AI-Proof Jobs in 2026: What the Evidence Shows
Oct 6, 2026 · Updated Oct 10, 2026 · 61 min read · AI Layoffs
What four independent kinds of evidence say about the jobs AI is least likely to take, and why "AI-proof" is a promise nobody can keep.
Corrected October 10, 2026: a re-check of the register against its sources removed two UPS announcements (about 20,000 jobs in 2025 and up to 30,000 in 2026), which no credible report tied to AI, regraded three cuts from declared AI-related to AI as one reason among several (CrowdStrike's and Chegg's two), and recorded Klarna's February 2024 announcement as a statement rather than a cut. The register figures in section 4 are recomputed (232 cuts, 176 where the employer named AI), and management's AI-layoffs count is 27 cuts, not 26, after Tata Consultancy Services' July 2025 cut was regraded on October 9. No group's score or rank changed.
Corrected October 8, 2026: we re-checked the job families of every cut in our register against each employer's own sources. That changed the AI-layoffs measure for six occupation groups: installation and repair now has no employer-named cut (Telus's 2024 reduction largely affected management professionals), management has more (26 cuts, was 21), and office and administrative support (29, was 56), computer and mathematical (44, was 59), business and finance (25, was 36) and sales (25, was 30) have fewer. Installation and repair moved from seventh to fifth, management from sixteenth to seventeenth and arts and media from eighteenth to twentieth; the ten most sheltered groups and the five least sheltered are the same. Section 4's chart and counts were updated to match.
Not one of the layoffs in our register of AI-linked cuts names a nurse, an electrician, a plumber or a cook among the roles that were cut. The register is the public record we keep at AI Layoffs, and every entry links to a source you can open, from a securities filing to a chief executive's memo. The roles that do appear are software engineers, customer service agents, back-office processors, marketers and middle managers. Meanwhile, employers kept hiring people whose work needs hands and presence. Since ChatGPT launched at the end of November 2022, the US has added about 3 million jobs in health care and social assistance - FRED. The government now projects 847,300 more home health and personal care aides by 2035, the largest increase of any occupation - BLS.
That contrast is the most useful fact anyone can offer about AI-proof jobs, and it is rarely where the lists start. Search the phrase and you get confident rankings built on a writer's sense of what feels human. The worry behind those searches is real: 52% of US workers say they are worried about the future impact of AI in the workplace, and 32% expect it to mean fewer job opportunities for them - Pew Research Center. People making career decisions on that worry deserve evidence rather than intuition.
This guide builds the answer from four independent kinds of evidence: what people actually use AI for, what employers cut when they named AI, where jobs actually grew after ChatGPT, and what the government projects to 2035. Where they agree, the line they draw is sharp, and it runs between work done on a screen and work done with a body in a place. Where they disagree, the disagreement tells you something too. We rank all 22 occupation groups the government uses, explain the four things that shelter a job, go field by field through health care, the trades, services, driving and the professions, and finish with a fifteen-minute test you can run on your own job.
Contents
- Why "AI-proof" is the wrong promise
- First principles: the four shelters
- Evidence one: what people actually use AI for
- Evidence two: what employers cut when they named AI
- Evidence three: where jobs grew after ChatGPT
- Evidence four: what the government projects to 2035
- The sheltered jobs, field by field
- Four ways a sheltered job can still lose
- How to test your own job in fifteen minutes
- If you are choosing a career now
- The bottom line
The scoreboard: 22 occupation groups ranked by shelter from AI
Before the detail, here is the whole picture in one table. It ranks the 22 major occupation groups that the US government uses to classify every job, each scored 0 to 10 on four measures drawn from the evidence in this guide. A higher score means the group is more sheltered from AI as of October 2026: less of its work flows through AI assistants today, more of it has to be done in person, fewer of its roles appear in layoffs where the employer named AI, and more demand for it is projected. The final column is the weighted average of the four, and the table is sorted by it.
Read it as a ranking of shelter, not of worth or pay. A group can be sheltered and still poorly paid, or shrinking for reasons that have nothing to do with AI, and the demand column exists so you can see that at a glance. Every cell gives the score together with the number behind it, so you can disagree with any of our choices and recompute the ranking yourself. The sources and the scoring rules sit directly below the table.
| # | Occupation group | AI use (30%) | Remote jobs (20%) | AI layoffs (30%) | Demand (20%) | Final |
|---|---|---|---|---|---|---|
| 1 | Healthcare support Home health aides, nursing assistants | 10 - 0.05 | 10 - 2% | 10 - none | 10 - grows 13.3% | 10.0 |
| 2 | Construction Electricians, plumbers, roofers | 9 - 0.07 | 10 - 0% | 10 - none | 5 - grows 5.1% | 8.7 |
| 3 | Cleaning and grounds Janitors, housekeepers, landscapers | 9 - 0.08 | 10 - 0% | 10 - none | 4 - grows 2.6% | 8.5 |
| 4 | Healthcare practitioners Nurses, physicians, therapists | 7 - 0.12 | 10 - 5% | 10 - none | 7 - grows 8.0% | 8.5 |
| 5 | Installation and repair HVAC technicians, mechanics | 8 - 0.10 | 10 - 1% | 10 - none | 5 - grows 5.4% | 8.4 |
| 6 | Transportation and moving Drivers, warehouse workers, pilots | 8 - 0.10 | 10 - 3% | 10 - none | 5 - grows 4.3% | 8.4 |
| 7 | Farming, fishing, forestry Farmworkers, loggers, fishers | 10 - 0.06 | 10 - 1% | 10 - none | 1 - shrinks 1.5% | 8.2 |
| 8 | Production Machinists, welders, assemblers | 8 - 0.11 | 10 - 1% | 10 - none | 2 - shrinks 0.4% | 7.8 |
| 9 | Food service Cooks, servers, bartenders | 5 - 0.17 | 10 - 0% | 10 - none | 5 - grows 4.4% | 7.5 |
| 10 | Protective service Police, firefighters, guards | 7 - 0.12 | 9 - 6% | 10 - none | 3 - grows 1.1% | 7.5 |
| 11 | Personal care Hairdressers, childcare workers | 5 - 0.18 | 7 - 26% | 10 - none | 5 - grows 4.4% | 6.9 |
| 12 | Sciences Scientists, lab technicians, economists | 4 - 0.19 | 5 - 54% | 10 - none | 7 - grows 7.5% | 6.6 |
| 13 | Social services Counselors, social workers, clergy | 2 - 0.25 | 6 - 37% | 10 - none | 7 - grows 7.4% | 6.2 |
| 14 | Architecture and engineering Engineers, architects, drafters | 3 - 0.22 | 4 - 61% | 10 - none | 6 - grows 6.8% | 5.9 |
| 15 | Legal Lawyers, judges, paralegals | 7 - 0.13 | 0 - 97% | 8 - 1 cut (Cloudflare) | 4 - grows 2.9% | 5.3 |
| 16 | Education Teachers, professors, librarians | 3 - 0.21 | 0 - 98% | 10 - none | 3 - grows 1.4% | 4.5 |
| 17 | Management Executives, managers | 7 - 0.13 | 1 - 87% | 2 - 27 cuts | 6 - grows 6.2% | 4.1 |
| 18 | Business and finance Accountants, analysts, HR specialists | 3 - 0.23 | 1 - 88% | 4 - 25 cuts | 5 - grows 5.5% | 3.3 |
| 19 | Sales Cashiers, sales representatives | 0 - 0.29 | 7 - 28% | 4 - 25 cuts | 2 - shrinks 1.4% | 3.0 |
| 20 | Arts and media Writers, designers, translators | 2 - 0.24 | 2 - 76% | 4 - 16 cuts | 3 - grows 1.5% | 2.8 |
| 21 | Computer and math Software developers, data scientists | 0 - 0.29 | 0 - 100% | 2 - 44 cuts | 7 - grows 7.3% | 2.0 |
| 22 | Office and admin Customer service reps, clerks | 1 - 0.26 | 4 - 65% | 2 - 29 cuts | 0 - shrinks 4.0% | 1.7 |
Each of the four measures has a source and a scoring rule, and the group names are shortened from the government's official titles. AI use (30%) is Microsoft Research's AI applicability score, built from 200,000 anonymized conversations with Bing Copilot, which measures how much of a group's work people bring to an AI assistant and how well it does that work - arXiv. Lower is more sheltered: 0.05 scores 10, 0.29 scores 0, and values in between scale evenly.
Remote jobs (20%) is the share of a group's jobs that can be done entirely from home, from economists Jonathan Dingel and Brent Neiman's classification of every US occupation - NBER. 0% scores 10 and 100% scores 0.
AI layoffs (30%) counts the cuts in our register, as checked for new events through October 3, 2026 and with job families re-checked on October 8, where the employer itself named AI among the reasons for a cut that included this group's roles, as the employer or named reporting described them. None scores 10, one or two score 8, three to ten score 6, 11 to 25 score 4, 26 to 50 score 2, and more than 50 score 0.
Demand (20%) is the Bureau of Labor Statistics' projected employment change for 2025 to 2035 - BLS. The steepest decline (-4.0%) scores 0, the fastest growth (+13.3%) scores 10, and values in between scale evenly.
Two of these choices need a health warning. The register files cuts under its own job families, and we mapped them onto the government's groups by hand: customer service, back-office operations and content moderation into office and administrative support; corporate functions and consulting into business and financial operations; software and IT into computer and mathematical; sales and marketing into sales; management layers into management; writing, editorial and translation, plus the product and design cuts that named designers or game studios, into arts and media; and the one cut that named legal staff into legal. Cuts where the employer did not say which roles went, 83 of the 176 where it named AI, count in no group, so the column understates every group and is approximate. Transportation scores no employer-named cut: UPS gave no AI reason for its large 2025 and 2026 cuts, and no credible report we found tied them to AI. And the remote-jobs measure was built in 2020, when teaching moved online, so it scores teachers as able to work from home, which understates how much a school depends on a person in the room.
What the table shows survives both caveats. All ten of the most sheltered groups are defined by work done with the body, in a place: caring, building, cleaning, moving, growing, repairing, making, cooking and protecting. The bottom five are where work passes through a screen: media, business operations, sales, computing and office administration. Two results deserve a second look before anyone uses the table to choose a career. Farming and production rank high on shelter yet are projected to shrink, because shelter from AI is not the same as a growing field. And computer and mathematical occupations rank 21st on shelter yet are still projected to grow 7.3%, because demand for software keeps rising even as AI writes more of it. Read the final column as protection and the demand column as opportunity, and look for groups that score well on both.
1. Why "AI-proof" is the wrong promise
The phrase borrows its logic from "waterproof": a property you either have or lack, guaranteed against whatever comes. No job has that property against a technology that improves every few months, and nothing in the evidence suggests otherwise. What the evidence does support is a gradient. Some work is deeply sheltered because AI cannot reach it, some is exposed but growing because cheaper work creates more demand, and some is exposed and shrinking because the demand was always fixed. A list that sorts jobs into "safe" and "doomed" erases that middle, and the middle is where most people actually work.
Lists of AI-proof jobs also have a track record, and it should make anyone cautious about trusting intuition. In 2016 the Nobel Prize-winning AI scientist Geoffrey Hinton said "people should stop training radiologists now." In 2025 American radiology programs offered a record 1,208 residency positions, and radiologists earned an average of $520,000, over 48% more than in 2015 - Works in Progress. The reasons are instructive. Image interpretation takes only about 36% of a radiologist's time, models that beat benchmarks lose accuracy in real hospitals, and malpractice insurers commonly cover reads only when a licensed physician has reviewed them. The task was exposed, and the job was protected by everything around the task.
The opposite error is just as common. Interpreters and translators have the highest AI applicability score of any occupation in Microsoft's data, at 0.49 - Microsoft Research. Researchers at Oxford found that US local labor markets where Google Translate spread further saw weaker translator employment and lower demand for foreign language skills - Oxford Martin School. Yet the government still projects translator employment to grow slightly, from 73,900 to 75,400 by 2035 - BLS. The work is under pressure without disappearing, which is exactly the outcome a yes-or-no list cannot express.
Even the researchers who measure this for a living are humble about predictions. Anthropic's economists open their 2026 study of AI and jobs by recalling that a prominent attempt to measure which jobs could be offshored flagged roughly a quarter of US jobs as vulnerable, and that a decade later most of those jobs had kept growing - Anthropic. So instead of asking whether a job is AI-proof, this guide asks three narrower questions that evidence can actually answer. Where does the work happen: on a screen, or with hands and presence in a particular place? Who answers for it: does a licensed or accountable person have to stand behind the result? And what happens when it gets cheaper: does the world want more of it, or the same amount from fewer people?
Those three questions separate the radiologist from the data entry clerk, even though both handle information that AI processes well. The radiologist's work is wrapped in accountability and faces growing demand for scans, while the data entry clerk's work was designed to need no judgment, and the volume of forms does not grow because typing got cheaper. The questions also work at any level of detail, from a whole occupation down to a single task, which is how you will apply them to your own job in section 9. The next section turns them into four shelters, because the first question splits in two: work that needs hands in a messy environment, and work where a human presence is the very thing being paid for.
2. First principles: the four shelters
Start from what today's AI actually is. It is software that turns patterns in text, code, images and data into new text, code, images and data, and it touches the world through a screen and whatever systems it is wired into. Everything it does to a job, it does by taking over tasks that pass through that screen. That gives a structural test for shelter that has nothing to do with collar color or prestige, and it explains why a hospital billing clerk is more exposed than the nurse down the hall, even though they work for the same employer and in the same building.
From that starting point, four properties shelter a job, and they compound. A job with one of them is partly protected, and a job with three or four is about as protected as work gets in 2026. None of them is permanent, and section 8 covers how each one can erode, but together they explain almost all of the pattern in the data that follows, including the cases that surprise people, like translators who are still employed and cashiers who are not sheltered at all.
- Physical work, messy settings. Hands in an unpredictable place: a crawlspace, a patient's home, a roof.
- Presence is the product. The customer is paying for a person: care, touch, reassurance, attention.
- Someone must answer for it. A license, a signature or legal liability ties the result to a person.
- Demand grows when the work gets cheaper. Cheaper output creates more work instead of fewer workers.
The first shelter is the strongest, and it is where robotics, not language models, sets the clock. McKinsey estimates that activities requiring physical as well as cognitive capabilities account for about 35% of current US work hours - diginomica. Robots already do some of that work in controlled spaces: Amazon deployed its one millionth warehouse robot in 2025, and by then robots assisted in some way with 75% of its global deliveries, The Wall Street Journal reported - TechCrunch. But a warehouse is engineered for machines, with flat floors, barcodes and predictable shelves. A ninety-year-old house with a leak behind a wall is not, and the gap between those two settings is why the International Federation of Robotics says mass adoption of humanoid robots as household helpers may not happen in the near or medium term - IFR.
The second shelter covers jobs where the person is the point. A home health aide's value is not information processing: it is helping someone out of bed, noticing that they look worse than yesterday, and being there. Dingel and Neiman's classification finds that only 2% of healthcare support jobs could be done from home, against 100% of computer and mathematical jobs - Dingel and Neiman. Personal care, therapy, hospitality and much of teaching sit on this side of the line. AI can make these workers more effective, by handling scheduling or notes, but it cannot be the thing the customer is paying for.
The third shelter is accountability, and it protects even work that AI can technically do. As of October 5, 2026, the AI Hallucination Cases Database listed 2,149 court and tribunal decisions worldwide that deal with reliance on AI-hallucinated material, most often invented case citations, 1,473 of them in the United States - AI Hallucination Cases Database. Almost all of them turned on a filing with a lawyer's or litigant's name on it, and that person, not the software, answered to the court. Licensed electricians sign off on installations, physicians sign orders, engineers stamp drawings and pilots fly under their own certificates. As long as the law requires a person to be responsible, the person stays in the loop, even as AI drafts more of the work.
The fourth shelter is the least intuitive and the most important for office workers. When AI makes a task cheaper, the outcome depends on whether the world wants more of it. Demand for software has proven elastic: the government projects software developer employment to grow 10.2% to 2035 even as AI writes more code - BLS. Demand for typed documents has not: word processors and typists are projected to shrink 34.4%, the fastest decline of any occupation - BLS projections. The same technology produces opposite outcomes depending on what happens to demand, which is why "how exposed is this job?" is only half of the question.
The shelters also explain why jobs that look alike end up in different places. A registered nurse has all four: physical work in an unpredictable setting, a patient paying for a person, a license, and demand that rises as the population ages. A software developer has mainly the fourth, which is why the occupation is projected to keep growing even as AI writes more code. A medical biller working for the same employer as the nurse has none of them, which is why the register shows health-care billing offices being cut while patient care is left alone. Counting shelters is a rough tool, but it predicts the pattern in the next four sections better than any judgment about which jobs feel human.
Put the three questions from section 1 together, task by task, and any job sorts into one of four outcomes. The diagram below is the test this guide applies to the evidence, and the one you can apply to yourself.
Notice that the test runs on tasks, not titles. A nurse's charting is exposed and the care is sheltered; an electrician's estimates are exposed and the wiring is not. Almost every job contains tasks on more than one branch, and the honest answer for most people is that AI will take a share of their week rather than their whole job. That is why the four kinds of evidence that follow matter: they show which branch dominates each occupation in practice, and they let you check the test against what has actually happened since ChatGPT launched, instead of trusting it as theory.
3. Evidence one: what people actually use AI for
The most direct way to see where AI reaches is to look at what people use it for at work. Two companies that run widely used AI assistants have published exactly that, and their methods are independent of each other. Anthropic analysed how its assistant Claude is used in professional settings, and Microsoft Research analysed 200,000 anonymized conversations with Bing Copilot. Both mapped each conversation onto O*NET, the government's catalog of the tasks that make up every occupation, so the results can be read job by job rather than as a vague sense of what AI is good at.
Anthropic's March 2026 study introduced a measure it calls observed exposure: of the tasks a language model could theoretically speed up, how many are actually being done with AI at work, with automated uses weighted more heavily than assistive ones - Anthropic. At the bottom of the distribution, 30% of workers have zero coverage, because their tasks barely appear in the data at all. The occupations Anthropic names in that group are cooks, motorcycle mechanics, lifeguards, bartenders, dishwashers and dressing room attendants. At the top, computer programmers have 75% of their tasks covered, followed by customer service representatives, with data entry keyers at 67%. Anthropic's chart of theoretical against observed coverage makes the line visible at a glance.
Where AI could work, and where it is actually used

The blue area is what a language model could theoretically speed up, and the red area is what is happening. The theoretical reach is enormous in office work: by the measure Anthropic uses, language models could speed up 94% of tasks in computer and mathematical occupations and 90% in office and administrative work, yet Claude covers just 33% of computer and mathematical tasks so far. For grounds maintenance, transportation, agriculture, construction and food service, both shapes stay close to the center: little of the work is theoretically within a language model's reach, and almost none of it is done with one yet. Healthcare support reaches further out in theory, but its observed coverage is also close to zero. These are not jobs where AI is held back by caution or regulation; they are jobs where a language model has almost nothing to do, because the work is done with hands, tools and bodies.
Microsoft's data draws the same line from a different product and a different population of users. Its researchers gave nearly every occupation an AI applicability score that combines whether its work activities come up in Copilot conversations often enough to count, how often the AI completes them successfully, and how much of each activity it handles - arXiv. Healthcare support has the lowest score of the 22 major groups at 0.05, while computer and mathematical occupations and sales share the highest at 0.29. The chart below shows groups from both ends of that range.
At the level of single occupations, the extremes are even clearer. The lowest scores in Microsoft's table belong to work like orderlies, water and wastewater treatment plant operators, rail-track equipment operators and dredge operators, all at zero, with housekeeping cleaners at 0.008, roofers at 0.009 and phlebotomists at 0.022 - Microsoft Research. The highest belong to interpreters and translators (0.49), historians (0.46) and writers and authors (0.45), with customer service representatives (0.41) not far behind. The pattern is not about education or pay: a historian and a customer service representative share a high score because both mostly produce and process information, and an oral surgeon and a dishwasher share a low one because both mostly work with their hands.
The pattern also holds outside the United States. The International Labour Organization, working with Poland's national research institute NASK on nearly 30,000 tasks, found that one in four jobs worldwide is potentially exposed to generative AI, with clerical work the most exposed of all, and concluded that "transformation, not replacement, is the most likely outcome" - ILO. Anthropic's June 2026 report adds that physical occupation groups, among them transportation and material moving, food preparation and serving, and construction and extraction, are under-represented both among its surveyed users and in Claude sessions - Anthropic Economic Index.
Usage data has one important limit, and it cuts both ways. It measures where AI is being pointed, not where jobs are being lost. High usage often means help rather than replacement: Indeed's analysis of nearly 2,900 work skills found that 26% of job postings could be "highly" transformed by generative AI and 54% "moderately", and it expects roles that need physical presence and human interaction, nursing among them, to be less affected, because the core of nursing "requires physical presence, emotional intelligence, and real-time human decision-making" - Indeed Hiring Lab. Low usage can also mean "not yet" rather than "never", which is why the next three kinds of evidence matter. Why this matters for you: if your work barely appears in these datasets, the language models that are reshaping office work have little to grab onto. How to apply it: check where your own tasks sit on the radar above, and treat a high score as a signal to move toward the parts of your job that the usage data cannot see.
4. Evidence two: what employers cut when they named AI
Usage shows where AI is pointed. Layoffs show where employers say it has already replaced people, and that is the evidence this site exists to keep. As checked for new events through October 3, 2026, our register of AI-linked layoffs held 241 events (as corrected on October 10) from 2023 to the end of September 2026, each linked to a source and graded by who connected it to AI. Nine are on-the-record employer statements about AI and the size of their workforce, and the other 232 are job cuts. In 26 of the cuts the employer declared the change AI-related, in 150 it named AI among other reasons, and in 56 the link to AI came from the press or other observers while the employer said something else or nothing. That leaves 176 cuts where the employer itself named AI. Where the employer, or reporting it cites, said which roles went, the register tags the cut with the job families it hit; in 83 of the 176, nobody said.
The pattern in the 93 cuts that name roles is the mirror image of the scoreboard. Software engineering and IT, management layers, sales and marketing, corporate functions such as finance and HR, and customer service account for most of them, and physical or in-person work does not appear. The counts below are a snapshot of that register, with every label re-checked against its sources on October 8, 2026; the live version, which moves with every register update, is on our page answering what jobs AI will replace. One cut can hit several families, so the bars add up to more than 93.
Frontline and manual work appears in one cut in total, and in none where the employer named AI. The largest physical cuts of the period belong to UPS, which announced about 20,000 operational job cuts in 2025 and up to 30,000 more in 2026 while it automates its sorting network. UPS tied both to the decline in its Amazon volume and named no AI cause, and no credible report we found tied either announcement to AI, so the register does not record them as AI-linked cuts; it records only UPS's running total for 2025, which the BBC discussed in a report on AI job cuts - UPS. That distinction matters for anyone in physical work: the machines thinning sorting jobs are conveyors and robots, a different technology on a different clock from the language models reshaping office work.
Health care appears in the register only through its back office. The Utah physician group Revere Health cut 177 roles in its central business office, medical billing, collections and claims processing when it handed that work to a partner promising machine learning and automated claims processing, and said patient care was unaffected; the register grades that cut explicit - Revere Health. CoxHealth in Springfield, Missouri moved 53 people on its revenue cycle team into other roles or out of the system after automating manual medical coding data entry. Its release credited technology and mentioned AI only in the context of retraining, so the register records it as press-attributed - CoxHealth. No clinical role appears in either event, which is exactly what the shelter test predicts for health care: the billing is exposed and the bedside is not.
Law shows the same split between an accountable profession and the work around it. Baker McKenzie was reported in February 2026 to be cutting fewer than 10% of its business-services staff worldwide, which the legal press put at 600 to 1,000 people, across IT, knowledge management, administration, marketing, design, secretarial and training roles, while the firm said it was "rethinking the ways in which we work, including through our use of AI"; no lawyers were targeted - Baker McKenzie. Clifford Chance proposed cutting about 50 London business-services roles in finance, HR and IT, and according to the Financial Times it told staff that greater use of AI was one of the reasons - Clifford Chance. The one employer-named event that touches a legal team directly is Cloudflare's 2026 cut of more than 1,100 people, which its founders tied to how the company must operate in the agentic AI era. Chief executive Matthew Prince later wrote that the vast majority of those laid off worked in middle management, finance, legal, internal auditing and revenue recognition - Cloudflare.
The register has a blind spot, and it is worth stating plainly. It sees what gets announced: public companies, large employers and technology firms that issue statements, file with regulators or attract the press. A five-person plumbing contractor that stops hiring an office manager because software now answers its phones will never issue a press release, so absence from the register is weaker evidence than presence in it. Our methodology explains how every event is graded, and our working paper on counting AI layoffs shows why only a fraction of reported AI layoffs carry a figure the employer itself stated. For the overall size of the AI-attributed total, see how many jobs AI has replaced, and for the replaced side of this question in depth, our earlier guide to which jobs AI is actually replacing.
Why this matters: the register is the only one of the four kinds of evidence that records what employers did rather than what AI could do, and it shows the cuts landing on screen work almost without exception. How to apply it: if your occupation shows up in the families at the top of the chart, look at the specific events on our company pages to see which tasks the employers said AI took over; if it does not show up at all, remember the blind spot and check the next two kinds of evidence before you relax.
5. Evidence three: where jobs grew after ChatGPT
If AI were already reshaping who works where, the government's payroll data would show it, and there are now almost four years of that data since ChatGPT launched. The chart below tracks employment from November 2022 for three industries whose work sits at opposite ends of the shelter test: health care and social assistance, construction, and information, the sector that includes publishing, broadcasting, telecommunications and software publishers. The numbers come from the monthly payroll survey of the Bureau of Labor Statistics, seasonally adjusted, through September 2026; the latest two months are preliminary and will be revised.
The divergence is stark. Health care and social assistance has added about 3.03 million jobs since November 2022, a gain of 14.5% - FRED. Construction has added about 501,000, a gain of 6.4% - FRED. Information employment has fallen by 376,000, or 12.1%, to its lowest level since December 2020 - FRED.
Over the same period total nonfarm employment grew 3.1% - FRED. The sheltered industries outran the economy, and the screen-heavy one shrank while the economy around it grew. That is the pattern the shelter test predicts, although, as the next paragraphs explain, it is not proof that AI caused it.
The finer industry detail tells the same story. Home health care services employment is up 21.3% since November 2022, about 333,000 jobs - FRED. Computer systems design and related services, the industry of IT consultancies and software contractors, is down 5.1% - FRED. Business support services, the industry that includes call centers, is down 19.0%, but that number carries a warning: it was already falling before ChatGPT existed, having lost about 7% between its February 2022 peak and November 2022 - FRED. A trend that starts before the technology cannot be blamed on the technology.
That warning applies to the whole chart. Interest rates rose sharply in 2022 and 2023, technology companies that over-hired during the pandemic corrected, the population aged and infrastructure spending grew, and every one of those forces pushes in the same direction as the AI story. The most careful trackers have not yet found an AI footprint in the overall numbers. The Yale Budget Lab's tracker, updated in September 2026 with August data, "does not provide clear evidence of labor market disruption associated with AI", and finds that churn across occupations, AI exposure among the unemployed and usage data "remain flat, lie within historical ranges, or continue along pre-AI trends" - Yale Budget Lab. Anthropic's study likewise finds no systematic increase in unemployment for highly exposed workers since late 2022 - Anthropic. We go through the unemployment evidence in detail on our page asking whether AI is causing unemployment.
Where a signal does show up is in who gets hired at the start of a career. Stanford's Digital Economy Lab follows millions of workers through payroll records from ADP, and its August 2026 update finds that employment of 22- to 25-year-olds in the two most AI-exposed fifths of occupations fell about 11% between November 2022 and June 2026, while employment of the same age group in the three least-exposed fifths grew about 10% - Stanford Digital Economy Lab. Employment of young workers in exposed occupations now stands about 19% below where it would be had it kept pace with that of their less-exposed peers, experienced workers show no comparable gap, and the declines are concentrated in occupations where AI is used to automate tasks rather than to help the people doing them.
Young workers' employment rose in the least exposed jobs and fell in the most exposed
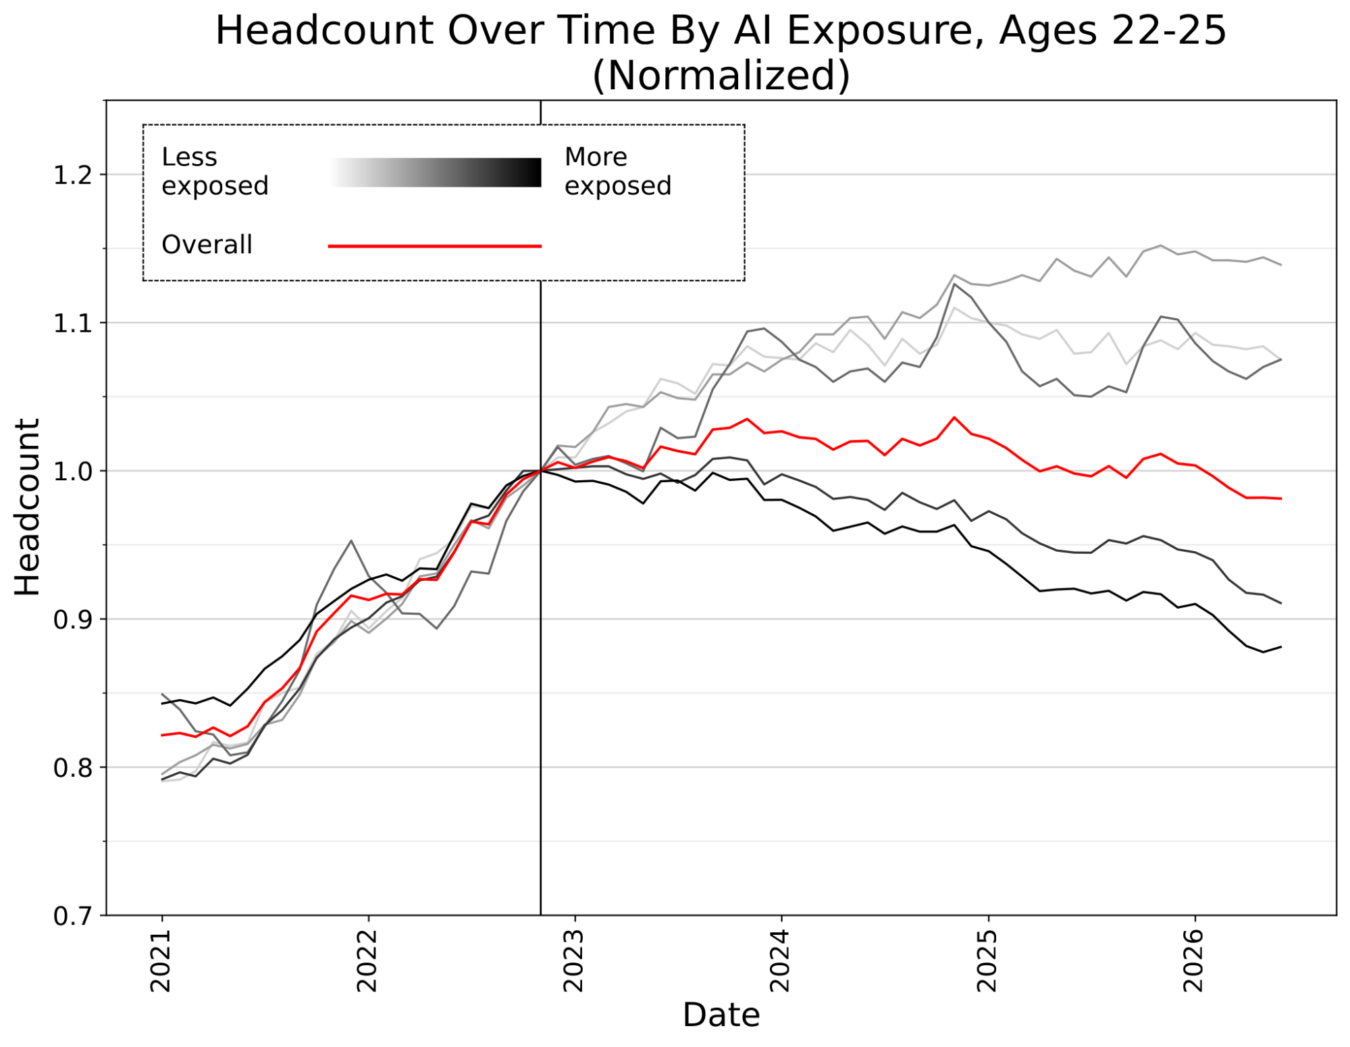
The least-exposed fifth in the Stanford data reads almost like a definition of the sheltered jobs. Its largest occupations include hand laborers and material movers, housekeeping cleaners, industrial truck operators, grounds maintenance workers, janitors, home health aides, automotive mechanics, construction laborers, dishwashers and plumbers - Stanford paper. The authors are careful about what their data can prove: they describe the patterns as "early, descriptive indicators" rather than causal estimates, they note that the patterns weaken when they control for education and that some divergence predates generative AI, and they find them more pronounced in the ADP sample than in national surveys.
Put those findings together and the shape is clear. Nobody has shown that AI has thrown large numbers of experienced office workers out of work, but the evidence that employers are hiring fewer young people into exposed occupations, and more into sheltered ones, keeps getting stronger with each release. Why this matters: the shelter effect shows up first in hiring, not firing, which means it matters most to people choosing or starting a career, and least to people already established in one. How to apply it: if you are early in your working life, weight the hiring evidence heavily, because it describes the doors that are opening and closing for people like you right now.
6. Evidence four: what the government projects to 2035
The Bureau of Labor Statistics projects employment ten years ahead, occupation by occupation, and its latest projections, released on August 27, 2026, cover 2025 to 2035. They expect the economy to add 5.9 million jobs, growth of 3.5%, slower than the 10.9% recorded over 2015 to 2025, and they expect the health care and social assistance sector to account for about 37% of all new jobs - BLS. The release also names artificial intelligence on both sides of the ledger, which makes it an official statement of where the government expects AI to shrink demand for work and where it expects AI to create it.
On the shrinking side, office and administrative support is projected to lose 752,100 jobs, a 4.0% decline, because, in the release's words, "the continued integration of automation tools, including those powered by AI, into workflows is likely to reduce demand for several office and administrative support occupations." Sales and related occupations are projected to fall 1.4%, with "incorporation of AI tools into the sales process" among the reasons. On the growing side, the release expects job growth in electric power generation, transmission and distribution "due to increasing demand for electricity, including artificial intelligence (AI) power demands." The chart below shows the projected change for eight groups.
The occupation-level tables sharpen the picture. The four fastest-declining occupations are word processors and typists (-34.4%), telephone operators (-27.6%), switchboard operators (-26.0%) and data entry keyers (-25.5%), and telemarketers (-21.4%) come seventh, behind two foundry trades - BLS. The largest losses in absolute numbers are cashiers (-200,600), general office clerks (-156,200), customer service representatives (-141,800), secretaries and administrative assistants outside legal, medical and executive offices (-114,100) and bookkeeping, accounting and auditing clerks (-85,600) - BLS projections. Leave aside the two foundry trades, and every name at the top of both lists is routine work done at a keyboard, a phone or a till.
The fastest-growing occupations are a mix worth reading closely: nurse practitioners (+41.0%), solar photovoltaic installers (+36.5%), data scientists (+34.6%), wind turbine service technicians (+29.5%), medical and health services managers (+24.2%) and physical therapist assistants (+23.0%) - BLS. Most of the list is sheltered clinical or physical work, but data scientists and computer research scientists sit on it too, a reminder that the government expects exposed but growing occupations to keep hiring even as AI changes the work inside them.
Projections are a consensus view, not a forecast you can bank. Anthropic's economists note that the government's occupational forecasts, "while directionally correct, have added little predictive value beyond linear extrapolation of past trends", and they found that the government's 2024-34 projections already showed weaker growth for occupations with more observed AI exposure, about 0.6 percentage points less growth for every 10 points of coverage - Anthropic. Why this matters: the official projections agree with the other three kinds of evidence on direction, which makes the direction hard to dismiss. How to apply it: use the projection for your occupation as a starting point, and adjust it with what the usage, layoff and hiring evidence says about how fast AI is moving in your corner of the economy.
7. The sheltered jobs, field by field
The scoreboard ranks whole groups, but careers are chosen one occupation at a time, and the groups hide a lot of variation. This section goes through the fields where the four kinds of evidence agree most strongly: hands-on health care, the skilled trades, in-person services, driving and warehouse work, and the professions that are exposed but still growing. For each, it sets out the pay, the projected demand, and what AI does change inside the field, because even the most sheltered job has exposed tasks around its edges.
All pay figures below are national medians for 2025 and all projections cover 2025 to 2035, both from the Bureau of Labor Statistics unless stated otherwise. Medians hide wide ranges by region, employer and experience, so treat them as a way to compare occupations with each other rather than as a promise of what any single job pays. Where the register holds events in a field, we link them, so you can read exactly what the employer said.
7.1 Hands-on health care
Health care is the clearest case of all four shelters at once: physical work in unpredictable settings, presence as the product, licensing and liability, and demand that grows as the population ages. Registered nurses earn a median of $97,550, their employment is projected to grow 6%, and about 180,800 openings are expected every year - BLS. Home health and personal care aides are projected to grow 18%, adding 847,300 jobs, and the job typically needs a high school diploma and short-term on-the-job training - BLS.
Health care fills six of the ten places on the government's list of the fastest-growing occupations, and five of those six are clinical roles that pair physical presence with patient care (the sixth is medical and health services managers) - BLS:
- Nurse practitioners: +41.0% to 2035, median pay $132,300.
- Physical therapist assistants: +23.0%, median pay $68,380.
- Psychiatric technicians: +22.3%, median pay $45,130.
- Occupational therapy assistants: +21.5%, median pay $72,300.
- Ophthalmic medical technicians: +21.4%, median pay $45,570.
Ophthalmic medical technicians are a neat illustration of how the evidence lines up. They score 0.007 on Microsoft's AI applicability measure, among the lowest of any occupation - Microsoft Research, and they rank tenth on the government's list of the fastest-growing occupations. What AI changes in health care is the paperwork around the care. Indeed found that 68% of the skills listed in the typical nursing job posting fall into its minimal-transformation category, with generative AI helping mainly on administrative tasks - Indeed Hiring Lab. The government's outlook for medical records specialists, still projected to grow 8%, warns that wider adoption of AI-powered solutions that make medical coding more efficient "may affect the demand for these workers" - BLS.
The register shows the same boundary from the employer side, as section 4 described: Revere Health's AI-linked cut took its billing, collections and claims staff and, by the company's account, left patient care untouched. One caution belongs here too. Sheltered is not the same as well paid: home health and personal care aides earn a median of $35,800 - BLS, well below the $50,980 median for all occupations - BLS, and the work is physically demanding. The best-protected and best-paid health careers combine presence with a license that takes years to earn, which is precisely what makes them hard to automate and hard to enter.
7.2 The skilled trades
The trades combine the first shelter with the third: hands in messy, one-of-a-kind settings, plus licenses and inspections that make a person answerable for the work. Electricians earn a median of $63,190, their employment is projected to grow 9%, and about 72,700 openings are expected every year; the usual path in is a high school diploma followed by an apprenticeship - BLS. The government's outlook names AI among the reasons electricians will be needed: "the increasing use of artificial intelligence (AI) technologies and demand for data centers to support this growth are expected to contribute to rising electricity demand." Heating, air conditioning and refrigeration technicians are projected to grow 11%, with data centers among the construction driving it - BLS. Plumbers, pipefitters and steamfitters are projected to grow 7%, with about 42,000 openings a year and four- or five-year apprenticeships - BLS.
This is a field where AI is creating demand for human labor, and faster than that labor can be trained. Electrical work accounts for 45% to 70% of a data center's construction cost, the industry needs more than 300,000 new electricians over the next decade, and about 20,000 electricians are expected to retire every year, according to reporting by Fortune, which also cited National Electrical Contractors Association figures showing commercial apprenticeship applications rising from about 70,000 to 120,000 between 2022 and 2024 - Fortune, via Yahoo Finance. "The fortunate thing is AI hasn't found a way to turn the wrench yet," a 22-year-old apprentice electrician told the magazine.
Geoffrey Hinton, who once told the world to stop training radiologists, has made the trades his example of safety. "I think plumbers are less at risk," he said on a podcast in June 2025. "Someone like a legal assistant, a paralegal, they're not going to be needed for very long" - NBC News. The usage data agree on the first half: roofers score 0.009 on Microsoft's measure and cement masons 0.015 - Microsoft Research. On the second half the government is less dramatic, projecting paralegal and legal assistant employment to be roughly flat (-0.3%) to 2035 - BLS, which is the pattern of an exposed occupation being squeezed rather than erased.
What AI does change in the trades is the office around the work: the phone that rings while the technician is under a sink, the dispatch board, the quote, the invoice and the follow-up. Founden, which is run by the same person who runs this site, publishes a ranked scoreboard of 16 unglamorous industries that scores, among other things, how much of each one's work current AI can do, and its verdict on home services and the trades is "front and back office only, wrench stays human". For a tradesperson that means the craft is sheltered while the administrative job next to it is not, which matters if you run a small shop, work for one, or are deciding between learning the trade and managing its office.
7.3 Personal care, food and in-person services
In-person services are sheltered mainly by the second shelter: the customer is paying for a person in the room. Anthropic's examples of occupations with zero observed AI coverage, cooks, bartenders, lifeguards and dishwashers among them, come mostly from this part of the economy - Anthropic. The government projects restaurant cooks to grow 12.1%, adding 171,400 jobs, and fast food and counter workers to add 223,300 - BLS. Massage therapists, whose work is touch itself, are projected to grow 15.3% - BLS projections. Hairdressers and fitness trainers are among the 50 largest occupations in Stanford's least-exposed group - Stanford paper.
Two warnings keep this from being a simple success story. The first is pay: the median for food preparation and serving occupations is $35,050 and for personal care and service $36,410, both well below the all-occupation median - BLS, so shelter here often comes with low wages and irregular hours. The second is that in-person is not the same as automation-proof. Cashiers face the largest projected job loss of any occupation, 200,600 jobs - BLS projections, and the government expects further growth of e-commerce and of AI tools in the sales process to keep contributing to job losses in the sales group - BLS release. A job can be safe from chatbots and still lose ground to a kiosk, an app or a change in how people shop, which is why the demand column in the scoreboard matters as much as the shelter score.
7.4 Driving and warehouse work: sheltered from chatbots, not from robots
Transportation ranks sixth on the scoreboard, level on score with installation and repair, because language models barely touch it: Microsoft's applicability score for the group is 0.10, and only 3% of its jobs could be done from home. But driving faces a different technology on its own timetable, and it is moving faster than most career lists admit. Waymo went from about 50,000 paid robotaxi rides a week in May 2024 to 500,000 a week across 10 US cities by March 2026 - TechCrunch. On September 1, 2026 it began public rides in Denver, San Diego and Tampa, bringing its service to 14 cities - Waymo.
The official projections have not caught up with that. The government still projects taxi drivers, shuttle drivers and chauffeurs to grow 9% to 2035, adding 41,400 jobs, and its outlook for the occupation does not mention self-driving vehicles at all - BLS. Heavy and tractor-trailer truck drivers are projected to grow 4%, with about 214,500 openings a year - BLS. Of all the places where the four kinds of evidence point the same way, this is the one where we would trust the projection least, because the usage data and the layoff record measure language models, and the threat to driving comes from autonomy.
Warehouses show the same split. Internal Amazon documents reported by The New York Times projected that automation would let the company avoid hiring more than 600,000 US workers it would otherwise need by 2033, and about 160,000 by 2027; Amazon said the documents do not reflect its entire strategy - Computerworld. Physical work also rides the business cycle: truck transportation employment is down 7.1% since November 2022, a reminder that being sheltered from AI does not shelter anyone from a freight slump - FRED. If you drive or move goods for a living, the right reading of the evidence is that you are sheltered from the technology that is reshaping offices, and exposed, on a slower clock, to the one that is reshaping roads and warehouses.
7.5 Exposed but growing: lawyers, accountants and software developers
The bottom of the scoreboard is not a list of doomed jobs. Several occupations in its lowest groups are projected to grow, because accountability and elastic demand protect the core of the work even as AI takes over tasks around it. The government projects lawyers to grow 4.7%, from 863,700 to 904,300 - BLS. It projects accountants and auditors to grow 5.0%, adding 79,400 jobs, and software developers to grow 10.2%, adding 174,700, among the largest gains of any occupation - BLS.
The squeeze lands on the routine tier underneath them. Bookkeeping, accounting and auditing clerks are projected to lose 85,600 jobs - BLS. Computer programmers, whose tasks show the highest AI coverage in Anthropic's data, are projected to shrink 7.3% while software developers grow - BLS projections. The industry data show the same tilt: employment in legal services is up 5.8% since November 2022 - FRED, while accounting, tax preparation, bookkeeping and payroll services, where routine processing is a larger share of the work, is down 1.1% - FRED. The lawyers and accountants who sign, advise and answer for the result are holding up; the people who prepared the inputs for them are the ones being thinned. The judgment and accountability that shelter these professions are now also paid by the hour, as AI training platforms hire lawyers, accountants and clinicians to evaluate model reasoning in their field; AITraining.jobs, which shares a founder with this site, lists those roles and what each platform pays.
Teaching sits in the same middle category for a different reason. Six in ten US public school teachers used AI tools for their work in the 2024-25 school year, most often for preparing to teach and making worksheets or activities, and those using them at least weekly estimated they saved 5.9 hours a week, about six weeks over a school year - Gallup. That is AI absorbing tasks around a job whose core, managing and teaching a room of children, depends on presence and trust. The government projects employment of elementary school teachers to be roughly flat to 2035, at -0.4% - BLS.
The practical lesson for everyone in this tier is that the shelter sits in specific parts of the job: judgment, accountability, client trust and work that grows when it gets cheaper. Stanford's finding that the losses are concentrated among young workers fits this picture, because entry-level roles in these professions are built from exactly the routine tasks AI now handles. Our earlier guide to which jobs AI is actually replacing goes deeper into those cuts, and our field report on what the 2026 layoff data shows explains why many headline "AI layoffs" turn out to have other causes.
8. Four ways a sheltered job can still lose
Shelter is a position, not a guarantee. The four properties that protect a job from today's AI can erode, be outflanked by a different technology, or simply stop mattering if the economy moves. The evidence in this guide describes the situation in October 2026, and anyone making a decision that will last a decade should know how each shelter could fail, so that they can watch for the signs rather than discover them too late.
There are four failure modes worth tracking, and each already has a real example. First, the office around a job automates: the core work stays human while the jobs supporting it disappear. Second, robots arrive on a slower clock: physical work is exposed to machines, just later and more unevenly than office work is exposed to software. Third, everyone crowds in: sheltered fields attract newcomers, which can hold wages down. Fourth, the economy moves anyway: demand for in-person work swings with the business cycle whatever AI does. None of these argues against choosing sheltered work, but each argues against treating any job, sheltered or not, as something you never have to think about again.
The first failure mode is already visible. Revere Health's patient care was untouched while its billing office went, and the government's outlook for customer service representatives, projected to decline 5%, notes that self-service systems and apps let customers handle simple tasks without a person - BLS. If your role in a sheltered industry is mostly scheduling, billing, coding or answering routine questions, you are in the exposed part of a sheltered business, and the shelter test in section 2 applies to you, not to the industry.
The second failure mode is the one people underrate, because robots have been "five years away" for so long. Bloomberg's April 2026 primer on humanoid robots is a good way to calibrate: it walks through the money flowing into the field, the shortage of training data for physical tasks, and real trials of humanoids in warehouses.
The chapters on the robot data gap (from 7:08) and on testing humanoids in warehouses (from 19:26) are the most relevant for anyone in physical work: the first is about the shortage of training data for physical tasks, and the second follows humanoids on trial in warehouses. The International Federation of Robotics puts it plainly: "If and when a mass adoption of humanoids will take place remains uncertain," in the words of Takayuki Ito, its president when the paper was published in August 2025 - IFR. The practical reading is to watch the structured end of your field. A robot that can sort parcels arrives years before one that can rewire a kitchen, and the order in which tasks fall will follow how predictable the setting is.
The third failure mode follows from everyone reading the same evidence. Enrollment at US public two-year colleges with a high vocational focus rose 11.7% in spring 2025, to 871,000 students, almost 20% above 2020 - National Student Clearinghouse. Growth at those colleges then slowed to 2.8% in spring 2026, after two years of strong gains - Clearinghouse Research Center. In a July 2025 Resume Builder survey of more than 1,400 Gen Z adults, 42% said they were already working in or pursuing blue-collar or skilled trade roles, citing student debt and the risk of AI replacement among their reasons - NBC News. A surge of newcomers is good for employers and for the shortage, but it can hold down wages in the most accessible trades, so the best-protected positions are the ones that take years of licensing and experience to reach.
The fourth failure mode is the oldest one. In-person work is sheltered from AI and fully exposed to everything else: during the COVID-19 pandemic, the workers least exposed to AI, who are more likely to hold in-person jobs, saw a much larger rise in unemployment than the most exposed - Anthropic. The data-center boom that is lifting electricians' pay is itself a construction cycle: an electricians' union business manager quoted by Fortune compared the work to "eating an elephant", a huge job that eventually ends - Fortune, via Yahoo Finance. Why this matters: shelter from AI is one input into career risk, not all of it. How to apply it: prefer sheltered work whose demand comes from something durable, such as an aging population, aging infrastructure or the energy transition, over sheltered work tied to a single boom.
9. How to test your own job in fifteen minutes
The scoreboard averages whole groups, and your job is a bundle of specific tasks that may sit on several branches of the shelter test at once. The most useful thing you can do with this guide is to run the test on your own week, because that answers the question no list can: how much of what you actually do could AI take over, and what is left when it does. It takes about fifteen minutes and a piece of paper, and it works for jobs no ranking has thought about.
Start by writing down what you actually did last week, not your job description, and estimate the share of your time each task took. Then go through the list with the three questions from section 1, marking each task honestly rather than hopefully. Most people find that their week is more mixed than their title suggests, and that the mix, not the title, is what decides their exposure.
Step one: list your real tasks and the share of a typical week each one takes. Be specific: "answering billing questions by phone, 30%" is useful, while "customer support" is not.
Step two: mark the physical tasks, the ones that need your hands or your presence in a particular place. Count a task as physical only if it genuinely cannot be done remotely or through a screen.
Step three: mark the accountable tasks, where your name, license or signature stands behind the result, or where a mistake would be legally or professionally yours to answer for.
Step four: ask the demand question of everything still unmarked. If this task cost half as much, would your employer or your customers want more of it, or the same amount done by fewer people?
Step five: check the trend for your occupation in the official outlook and in our register, to see whether the direction the evidence points matches what your own list suggests.
Take a worked example. A medical biller might find that 70% of the week is coding claims and answering routine billing questions, none of it physical, little of it signed off personally, and with demand that does not grow when it gets cheaper. That is the exposed and shrinking branch, and it matches both the register's health-care events and the warning about AI-powered coding in the government's outlook for medical records specialists. An electrician doing the same exercise might find that 80% of the week is installation and repair on site, under a license, with 20% spent on quotes and paperwork. The 20% is exposed; the 80% is about as sheltered as work gets.
If most of your week ends up unmarked, routine screen work for which demand would not grow, you are in the exposed and shrinking branch, and the right response is to move deliberately toward the marked tasks: more client contact, more responsibility, more physical or on-site work, or a role supervising the AI that does the unmarked part. If most of your week is marked, you are sheltered for now, and your risk is the failure modes in section 8 rather than a chatbot. If the result is mixed, which it is for most people, the realistic outlook is that AI takes a share of your week rather than your job, and the people who do best are the ones who decide in advance which share they want to keep.
For the fifth step, the government's Occupational Outlook Handbook gives pay, training and projections for hundreds of occupations - BLS. Our company pages and event register show what employers in your industry have actually said when they cut jobs and named AI, and the live breakdown on what jobs AI will replace shows which job families those cuts land on, updated as the register grows. If your occupation keeps appearing there, take that more seriously than any ranking that calls it safe.
10. If you are choosing a career now
For someone choosing a first career or retraining, the evidence points to a simple rule: look for work that scores well on both shelter and demand, and then weigh pay and the cost of getting in. A sheltered job with shrinking demand is a slow decline, and a growing job with no shelter is a race against the next model release. The careers that combine both tend to involve a body, a license and a durable source of demand, and several of them are reachable without a four-year degree.
A few examples from the government's data show what that combination looks like in practice. Each of these pairs physical or in-person work with a credential or specialized training, and each is projected to grow faster than the 3.5% average for all occupations:
| Career | Median pay (2025) | Projected change, 2025-35 | Main shelter |
|---|---|---|---|
| Wind turbine service technician | $64,120 | +29.5% | Physical, on-site work; energy demand |
| Industrial machinery mechanic | $64,520 | +17.8% | Hands-on, on-site repair work |
| HVAC technician | $61,010 | +11% | On-site work, certification, data-center demand |
| Electrician | $63,190 | +9% | On-site work, apprenticeship, electricity demand |
| Registered nurse | $97,550 | +6% | Patient care, licensing, an aging population |
The entry paths differ more than the pay does. Registered nurses typically need a bachelor's degree in nursing, although some enter with an associate degree; electricians usually start with a high school diploma followed by an apprenticeship; and HVAC technicians typically complete a postsecondary nondegree program, such as a certificate.
None of these is the "best" career in the abstract, and the table leaves out fields that pay far more, such as nurse practitioners at $132,300, because that path typically requires a master's degree, which changes the calculation - BLS. The point of the table is the pattern: hands-on, licensed or certified work, tied to health care, buildings, machines or energy, all of which have demand drivers that do not depend on any one company or boom. The figures for nurses, electricians and HVAC technicians come from their occupational outlooks cited in section 7, and those for mechanics and wind technicians from the government's table of the fastest-growing occupations - BLS.
Students are already moving. In spring 2026, undergraduate enrollment in computer and information sciences fell 8.4% at four-year institutions and 11.2% at two-year institutions, while undergraduate enrollment in health professions rose between 6.0% and 7.1% across every type of program and institution, for the third year in a row - National Student Clearinghouse Research Center. That shift is rational, but it is also a reason not to over-correct. Software developers are still projected to grow 10.2%, and the people who combine technical skill with judgment and accountability will remain in demand. The worst outcome is choosing work you will dislike for thirty years because a list called it safe.
Whatever you choose, the most durable protection is a combination rather than a refuge: a core of sheltered work plus fluency with the AI tools that will absorb the routine tasks around it. Nurses who use AI for charting, electricians who let software run their scheduling and quoting, and lawyers who use it for first drafts while keeping the judgment for themselves are all doing the same thing. They are keeping the part of the job that AI cannot reach and handing over the part it can.
11. The bottom line
There is no such thing as an AI-proof job, but there is such a thing as a well-sheltered one, and the evidence agrees remarkably well on what it looks like. Usage data from two AI companies, 235 source-cited job cuts linked to AI, almost four years of payroll records and the government's ten-year projections all draw the same line: work done with a body in a place, under someone's license, for a demand that keeps growing, is the work AI is least able to take.
For decisions, the evidence sorts work into three tiers. Sheltered: hands-on health care, the skilled trades, cleaning and grounds work, protective services and most in-person services, where the risk comes from robots on a slower clock, from crowding and from the economy rather than from AI. Exposed but growing: lawyers, accountants, software developers and other professions where accountability and elastic demand protect the core of the work while AI shrinks the routine tier underneath, and where the cost falls hardest on people trying to get a first job. Exposed and shrinking: routine screen, phone and counter work with fixed demand, such as data entry, typing, telemarketing and much of customer service, where the government already projects steep declines and names AI among the reasons.
If you are in the first tier, watch the failure modes in section 8. If you are in the second, move toward the judgment, the signature and the client relationship. If you are in the third, the shelter test in section 2 and the fifteen-minute exercise in section 9 are the most useful things in this guide, because they show which of your tasks to grow toward before the decision is made for you.
This guide will age, and we will keep its foundations current. The register behind it is updated as new cuts are announced and existing ones are re-checked, every event is open on our events page, and the full dataset is free to download as an open file and API from our data page. The live version of the job-family breakdown is on what jobs AI will replace, the composite AI Layoffs Index tracks the overall signal month by month, and our FAQ answers the questions readers ask most often.
This guide reflects data available on October 6, 2026: the AI Layoffs register as checked for new events through October 3, 2026 (243 events, 235 of them cuts; job families re-checked on October 8, 2026), BLS employment projections for 2025 to 2035 released on August 27, 2026, payroll data through September 2026 (the latest months are preliminary), and the research cited inline. Projections, usage measures and the register all change; check the linked sources for current figures before making a decision that depends on them.